Black Lives, Policing, and How the Illusion of Proximity Perpetuates Injustice
June 9, 2020
By Mariah Williams.
This week’s post is a little long, but certainly not as long as the 400 years black people have suffered injustice in America or the time we’ve endured anti-blackness globally. Nothing amounts to the centuries of oppression that black people have experienced, but it’s important to recollect the events that have led the nation and the world to this moment.
Two weeks ago, I participated in a community conversation called “Social Distancing and the Issue of Proximity” with the Office of Community Wealth Building in the city of Richmond. It tackled social distancing slightly differently from the way we’ve talked about it over the past few months. Participants were reminded that social distancing and proximity were concepts that impacted us well before a global health crisis emerged, as many of us have allowed structural and institutional inequality to intensify the social and physical distance between us.
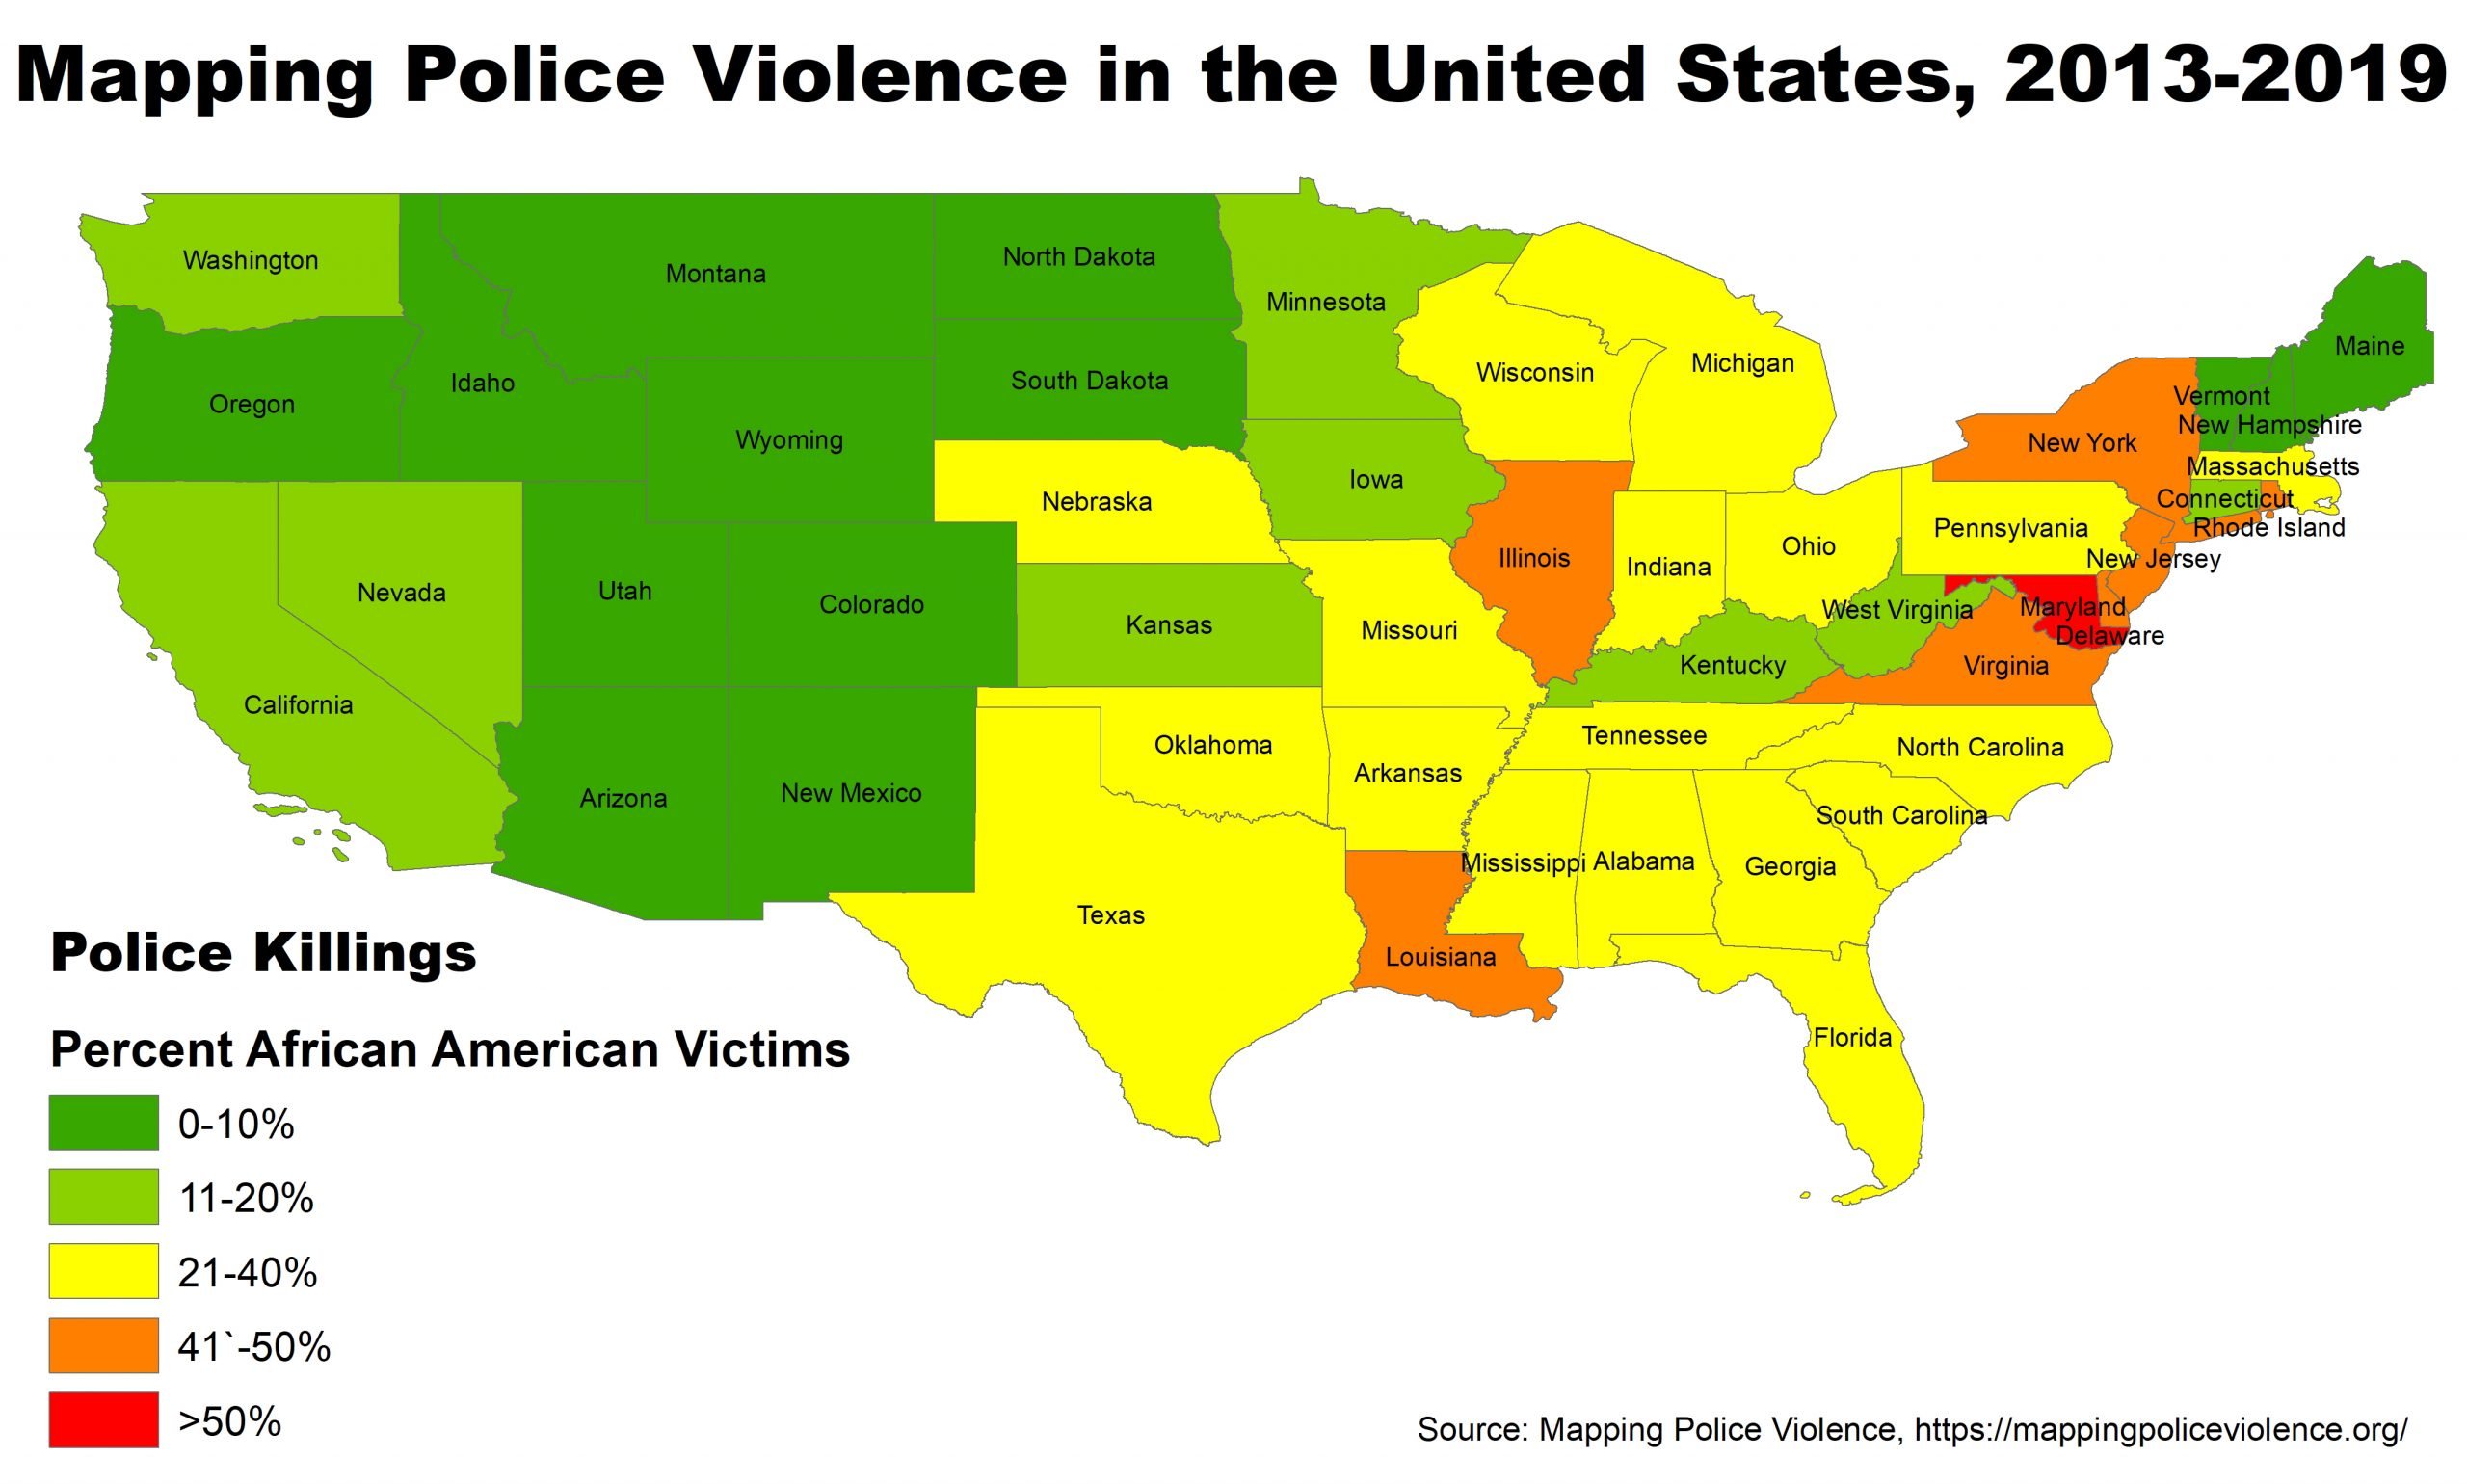
In America, this distance has been widened by racist policies that reinforce social and economic inequity and continued violence against black bodies. The manifestation of this social distance looks like 22.5 percent of African Americans living in poverty and comprising 34 percent of the country’s incarcerated despite being only 12.3 percent of the population. It looks like schools in black communities being underfunded and under resourced. It looks like black wealth declining by 75 percent between 1982 and 2013 due to decades of structural racism in the housing industry. It looks like African Americans and black women being 2.5 and 1.4 times more likely to be killed by law enforcement than white people, respectively, because more often than not, due to the growing segregation of our communities and neighborhoods, police officers do not live in the communities or near the people they vow to protect and serve.
While complex, the issues of proximity and social distancing are a part of the American fabric. In many ways, it is catch 22, because while policies were put in place to create physical distance between blacks and whites, this has not protected black people from the violent and oppressive conditions of white supremacy, as institutional racism reaches far and wide. De jure and de facto housing segregation have often been coupled with the over policing of black bodies in communities of color, increasing the chances of aggressive and deadly encounters. Furthermore, the perception folks have of housing in this country, perceptions based on overused terms and programs like affordable, projects, and Section 8, bring police closer while further distancing them from the realities of the community.
In 2018, public health researchers from Boston University set out to understand the extent to which police shootings reflect structural racism, particularly racial segregation, in America. They designed the State Racism Index to measure black-white residential segregation and disparities in economic status, employment status, educational attainment, and incarceration rates. They found that “for every 10 point increase in the state racial segregation index, there was a 67 percent increase in the state’s ratio of police shootings of unarmed Black victims to unarmed White victims.”
Virginia ranked 19th in the country with a state racism index of 49.2. This indicates higher black-white disparities in rates of police shootings of unarmed victims and factors in the state’s dissimilarity and isolation indices, reflecting the high level of residential segregation between blacks and whites.
| Rank | State | State Racism Index |
Black Shootings Rate (per 1,000,000 person-years) |
White Shootings Rate | Black Unarmed Shootings Rate |
White Unarmed Shootings Rate |
|---|---|---|---|---|---|---|
| 1 | Wisconsin | 74.9 | 10.6 | 1.82 | 2.23 | 0.14 |
| 2 | Minnesota | 70 | 6.34 | 1.54 | 1.27 | 0.25 |
| 3 | New Jersey | 68.5 | 5.06 | 0.83 | 1.47 | 0.22 |
| 4 | Illinois | 67.8 | 7.5 | 0.91 | 1.15 | 0.06 |
| 5 | Connecticut | 63.9 | 1.03 | 0.99 | 0 | 0.27 |
| 6 | New York | 60.3 | 2.55 | 0.64 | 0.68 | 0.1 |
| 7 | Pennsylvania | 59.1 | 5.04 | 1.03 | 0.43 | 0.18 |
| 8 | Iowa | 59.1 | 5.54 | 1.55 | 0 | 0.33 |
| 9 | California | 56.8 | 9.99 | 3.3 | 3.05 | 0.59 |
| 10 | Michigan | 55.6 | 3.98 | 1.06 | 0.46 | 0.12 |
| 11 | Colorado | 55.5 | 9.28 | 3 | 0.84 | 0.29 |
| 12 | Massachusetts | 54.6 | 4.86 | 0.75 | 0.37 | 0.13 |
| 13 | Nebraska | 53.4 | 11.08 | 2.77 | 2.22 | 0.29 |
| 14 | Rhode Island | 52 | 5.01 | 0.28 | 2.51 | 0 |
| 15 | Kansas | 51.2 | 6.83 | 3.17 | 0 | 0.69 |
| 16 | Ohio | 50.4 | 5.67 | 1.64 | 1.45 | 0.33 |
| 17 | Maine | 50.1 | 10.22 | 3.72 | 10.22 | 0.18 |
| 18 | Maryland | 49.7 | 6.11 | 1.62 | 1.2 | 0.63 |
| 19 | Virginia | 49.2 | 4.08 | 1.13 | 1.18 | 0.08 |
| 20 | Louisiana | 48 | 7.11 | 2.48 | 1.16 | 0.72 |
| 21 | South Carolina | 46.7 | 4.22 | 3.11 | 0.32 | 0.5 |
| 22 | Indiana | 46.4 | 9.07 | 1.71 | 2.02 | 0.25 |
| 23 | Utah | 45.1 | 9.62 | 3.36 | 4.81 | 0.84 |
| 24 | Missouri | 44.6 | 13.51 | 2.59 | 2.7 | 0.32 |
| 25 | Texas | 43.9 | 5.87 | 3.12 | 1.4 | 0.43 |
| 26 | North Carolina | 43.3 | 4.82 | 1.96 | 1.08 | 0.28 |
| 27 | South Dakota | 43.3 | 0 | 1.87 | 0 | 0.31 |
| 28 | Mississippi | 42.3 | 3.73 | 2.98 | 1.18 | 0.52 |
| 29 | North Dakota | 41.9 | 0 | 1.03 | 0 | 0.34 |
| 30 | Vermont | 41.6 | 0 | 1.13 | 0 | 0 |
| 31 | Arkansas | 41.3 | 6.1 | 3.34 | 0.94 | 0.4 |
| 32 | Alabama | 41.2 | 5.6 | 3.24 | 1.02 | 0.83 |
| 33 | Alaska | 40.8 | 20.14 | 3.79 | 0 | 0.47 |
| 34 | Georgia | 40.3 | 2.44 | 2.33 | 0.81 | 0.28 |
| 35 | Florida | 39.7 | 7.01 | 2.86 | 2.12 | 0.37 |
| 36 | Oklahoma | 39.2 | 20.52 | 5.76 | 2.74 | 0.83 |
| 37 | Washington | 38.6 | 10.04 | 3.01 | 2.01 | 0.31 |
| 38 | Delaware | 38.5 | 6.17 | 2.22 | 1.03 | 0.74 |
| 39 | Tennessee | 38 | 4.27 | 3.15 | 0.97 | 0.58 |
| 40 | Oregon | 36.5 | 11.47 | 3.7 | 2.29 | 0.64 |
| 41 | West Virginia | 36.2 | 15.54 | 4.41 | 0 | 0.52 |
| 42 | Idaho | 36.1 | 0 | 2.9 | 0 | 0.16 |
| 43 | New Mexico | 36 | 11.44 | 7.39 | 0 | 1.37 |
| 44 | Wyoming | 35.6 | 0 | 4.04 | 0 | 0.45 |
| 45 | Arizona | 34.8 | 10.78 | 5.15 | 3.8 | 0.81 |
| 46 | Nevada | 34.7 | 8.6 | 6.43 | 3.91 | 0.6 |
| 47 | New Hampshire | 34.4 | 19.96 | 1.82 | 0 | 0.36 |
| 48 | Kentucky | 34.1 | 6.45 | 3.16 | 0.59 | 0.35 |
| 49 | Hawaii | 28.5 | 5.53 | 1.27 | 0 | 0 |
| 50 | Montana | 25.9 | 0 | 4.44 | 0 | 1.08 |
Source: “The Relationship Between Structural Racism and Black-White Disparities in Fatal Police Shootings at the State Level”, The Journal of National American Association, 2018
What happened to George Floyd, Breonna Taylor, Amaud Arbery, Sean Reed, and the countless other black people that have died at the hands of the police, is shaped by segregation, the increased social and physical distance seen throughout American cities today, and the perceived danger of black bodies and black communities. To say that these deadly encounters are mere manifestations of interpersonal racism diminishes the deeply rooted structural and institutional racism built into America’s housing system, and therefore our law enforcement institutions.
The irony of it all is that while our black bodies and communities have drawn law enforcement closer, the reality is that these outsiders have long distanced themselves, aided and abetted by the systems that work to separate us.
#BlackLivesMatter
Copyright , Housing Opportunities Made Equal of Virginia